In order to better envisage the way that economics works, a model is often used to represent certain parts (or all) of the subject. In the following examples a number of models or diagrams are shown, to illustrate some of the ways that this modeling is applied. Some of these models are for microeconomics and others are for macroeconomics in their form and presentation.
Macroeconomic Models are part of the IB Syllabus for macroeconomics as well as the syllabus for AP Macroeconomics for National Income and Price Determination.
Aggregate Supply[]
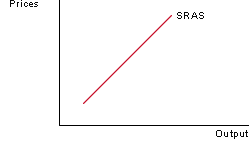
Short run aggregate supply (SRAS) is the supply of all finished goods and services within an economy at a given price level (in the short run). The aggregate supply curve describes the relationship between price levels and the quantity of output that firms are willing to provide based on those prices. The curve is upwards sloping. This characteristic happens because there is an incentive to produce more at a higher price. Also, increased production of a good comes at increased production costs because producers have different opportunity costs to produce a good. Thus, at times production costs rise when more units of a good are produced so a higher price is needed to elicit more output.
Long run aggregate supply (LRAS) is the vertical line at the level of Natural Real GDP or Full Employment level of National Income. It shows the output the economy produces when wages and prices have adjusted to their final equilibrium levels and neither the producers or workers have any misperceptions. It is the "ideal" state of the economy - i.e., it is the level of output that would occur if all resources were used to their full potential. This is why LRAS is vertical - real GDP (x-axis) is independent of the Price Level (y-axis).
There are two views in economics: the Classical & Neo-Classical and the Keynesian views. Prior to the 1930's, economists viewed the cycle of money and markets from a Neo-classical point of view. Neo-Classical economists view the LRAS curve as being perfectly inelastic (a price change for an item does not result in a unit change in supply) at a level of output where actual GDP has achieved its potential. Real GDP will always return to the level where all available labor resources find employment. Neo-Classical approach to Aggregate Supply is modeled in Figure A.
Figure A
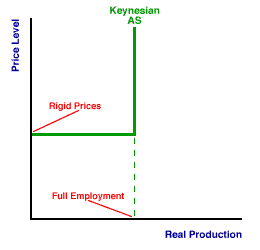
In the Keynesian view, the Aggregate Supply curve consists of two segments. One of them is completely horizontal, indicating that there is a decrease in Real Output as the demand declines because prices remain constant. The other segment is completely vertical, indicating that Full Employment is sustainable at higher price levels. The Keynesian view is modeled in Figure B.
Figure B
Full Employment Level of National Income[]
Full employment level of National Income means the level of GDP attained when there is no cyclical unemployment. This means that no one is unemployed due to cyclical changes in the economy (i.e... recessions or inflationary gaps). The full employment level is when an economy is operating with only Seasonal, Frictional, and Structural unemployment. Seaonal unemployment refers to when an individual works only during certain time periods of the year. Frictional unemployment is when an individual is in the process of transitioning between jobs. Structural umemployment is when the labor market does not have a substancial number of jobs for the individuals that want one. These three types of unemployment are called "natural" unemployment, and a healthy economy operating at Full Employment always has 2-3% unemployment due to the natural rate of unemployment.
Equilibrium Level of National Income[]
Inflationary and Deflationary Gaps:
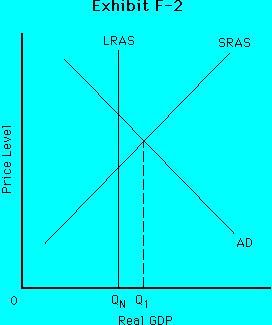
Inflationary Gap- The amount by which the real GDP (Gross Domestic Product) exceeds potential GDP. When the equilibrium between SRAS and AD is to the right of LRAS. The triang'e created from the intersection of the SRAS, AD and LRAS curves pointing to the left is the inflationary gap. Refer to Exhibit F-2.
In an inflationary gap there are too many workers working for low wages. Consequently, in the labor market, demand for people to work from firms exceeds the supply of people willing to work because of low wages, thus there is a shortage of labor during an inflationary gap.
Also, when real GDP>Natural Real GDP and unemployment<natural employment rate. This means that a shortage of labor would not be 0% unemployment. There would still be some employment it would just be below the natural rate.

http://www.austincc.edu/sondg/images/graphs/inflationaryGapF-2.gif
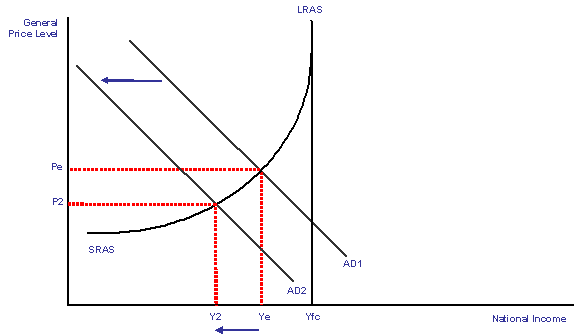
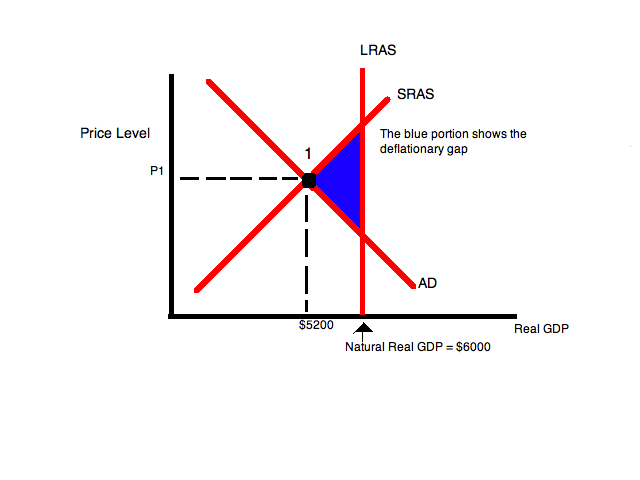
Recessionary (Deflationary) Gap- The condition where the Real GDP the economy is producing is less than the Natural Real GDP and the unemployment rate is greater than the natural unemployment rate. This condition is mapped out on the AS/AD graph where equilibrium between SRAS and AD is to the left of LRAS as seen in the "AD/AS Curves" figure to the middle bottom right.
It is the opposite of inflationary; deflationary happens when recessionary happens which is to say that there are not enough jobs for all the laborers who are able and willing to work.
In a deflationary gap there are too few workers working for too high of a wage. The blue portion from figure "AD/AS Curves" shows the deflation gap. In a recessionary gap, there is a surplus of labor. The supply of labor is greater than the demand of labor
AS/AD Curves

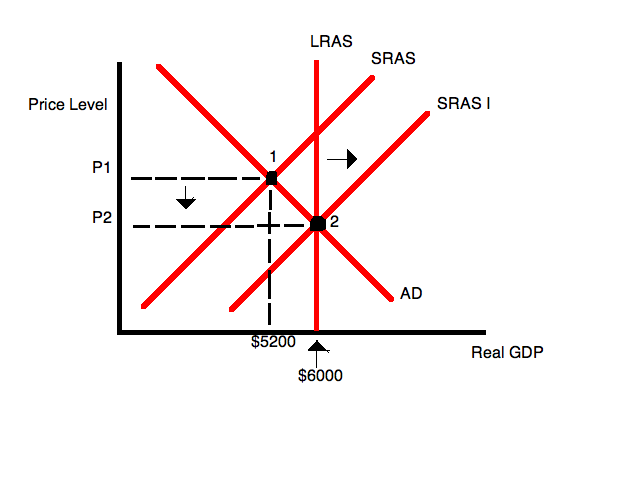
Businesses must fire workers, or lower wages to return back to equilibrium. Most businesses will lower wages, which causes SRAS to shift to the right because lower wages means less input prices. Lower input prices lead to higher production, thus increasing SRAS. As the price level falls, real balance, interest rate and international trade effects increase the quantity demanded of Real GDP. The economy is now at equilibrium point two.
- Note: Lowering wages are effective because it's either you work for this lower wage or you are fired. Most workers value their services at a higher wage, therefore, people who get fired contributes to the productivity increase in SRAS alongside lowering wages (input prices).
Business Cycle[]
The business cycle shows the shape of the economy that follows a loop trend. The straight line sloping upward is the Long Run Aggregate Supply Curve (LRAS) placed horizontally, while the curve that is looping the straight line is the Short Run Aggregate Supply Curve(SRAS) and Aggregate Demand Curve(AD) and their result. Where a trough is seen on the graph represents the deflationary gaps within the economy's timeline. When a peak is formed, it represents the inflationary gap within the economy (production is above sustainable levels).
Growth in a developed country steadily increases over time.
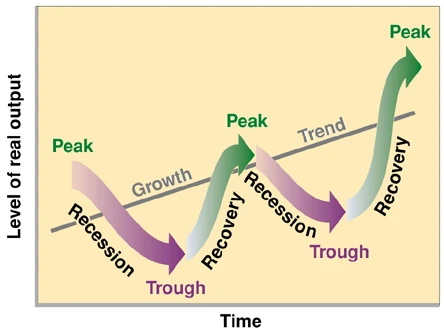
The Business Cycle supports the Neo-Classical approach to the economy that says if a free market economy is left to its own devices, it will naturally have ups and downs and will always correct itself with time and return to full employment.
In the Business Cycle, if a country doesn't do anything to get out of an inflation or recession, then the automatic stablizers would work instantly but for the discretionary, but it will take the process very long to get out of the situation. The self-regulating processes of the economy will then kick in.
In the business cycle, there will be 5 points where the following things happen; 1) Peak - real GDP, high, 2) Contraction - "recession", 3)Trough - low point, 4) Recovery - Real GDP rising, and 5)Expansion - real GDP increase
This is a cycle so these 5 points repeat over and over again.
Components of Aggregate Demand (AD)[]
AD = C + I + G + (X - M)
Aggregate Demand = Consumption + Investment + Government Spending + Net Exports (Exports - Imports)
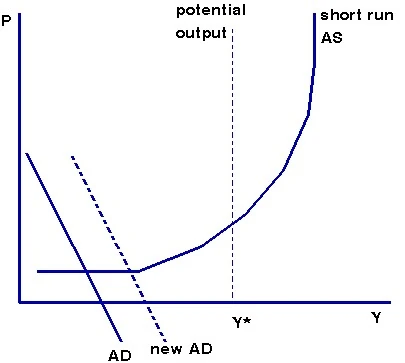
AD will shift to the right, or increase, if any of these occur :
Consumption increases-
Perceived wealth, or the money people believe they have, increases --> More money means opportunity cost of spending decreases, people spend more of their money
Inflation is expected to increase --> People act in such a way to use their money now before the prices start rising, thus increasing Consumption
Interest Rates decrease --> The opportunity cost of borrowing money decreases with lower interest rates, so people will invest and borrow money to spend.
Personal taxes decrease --> Less taxing on people's paycheck leads to them spending money because they have more money.
Expected income increases --> Same effect as perceived weallth and Tax decrease. Since people think that they will be paid more, they think that they will have more money to spend, so they spend more.
Investment increases-
Future sales in a company are expected to increase. If people are going to buy more in the future, we need to invest and produce more now.
Interest rates decrease --> Businesses invest their money on further development because it's cheaper to borrow money when interest rates are low.
Business taxes decrease --> Same reason as when people's taxes decrease. More money to allocate elsewhere, such as investment, to increase productivity.
Net Exports (imports subtracted from exports) increase-
Foreign prices increase, making our goods seem cheaper by comparison. Foreigners buy more of our goods as a result.
Foreigners get richer, so our goods seem less expensive. Foreigners buy more of our goods as a result and we import the same from foreigners or less from foreigners.
Currency value decreases.
As net exports increase that means we are decreasing our dependancy on foreign goods/services and buying domestically. NX= EX-IM
Government Spending increases-
Includes federal, state and local government purchase of goods and services and gross investment in highways, bridges etc. The investment will flow back out into the economy through the company paying its workers. Which then AD increases. As G increases, AD increases since G is a component of AD.